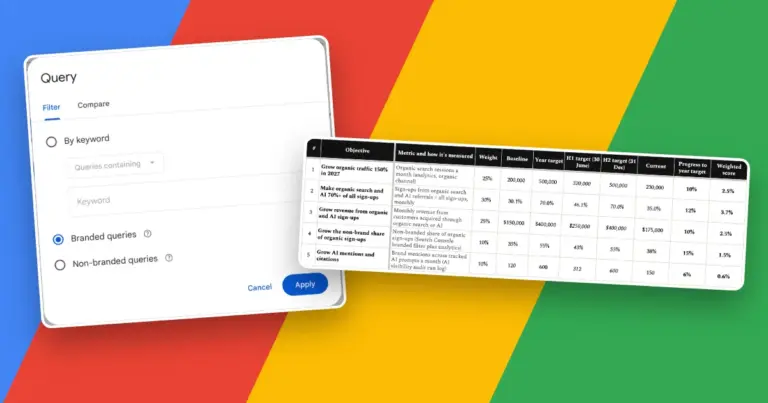
Dashboards and reporting skills
Dashboards and Reporting Skills-md for AI Agents
Dashboards and reporting skills-md are SKILL.md files that teach Claude, Codex and other agents to turn raw numbers into something a person can act on. They cover the layout and hierarchy of a dashboard, the right chart for each question, and a written report that leads with the decision rather than the data.
6 of 6 skills published, version 1.0.0.
By Afeez Adebayo, Marketing, SEO & Growth Expert with 10+ years of experience.
Created 2 November 2026. Updated 2 November 2026. Free to use under CC BY 4.0.
Where to start: use metric-selection to choose the few numbers worth tracking, dashboard-design for the layout and hierarchy, and chart-selection to match each chart to its question, then dashboard-filters-interactivity to make it interactive, data-storytelling to turn the result into a narrative, and report-automation to deliver it on a schedule.
Dashboard Design
dashboard-design · design the dashboard · 3,492 words · start here
Designs a dashboard people return to and act on: the few metrics that drive a decision, a clear top-to-bottom hierarchy, the right chart per tile, and the context, colour and load rules that keep it trusted.
Chart Selection
chart-selection · design the dashboard · 2,820 words
Chooses the right chart for a question and its data: names the relationship, reads the data shape, picks from a decision table, then applies integrity and accessibility rules so the chart does not mislead.
Metric selection
metric-selection · choose the metrics · 3,807 words
Picks the few metrics worth tracking: one primary metric that reflects real value, three to five inputs a team can move, and the guardrails that stop them being gamed.
Report automation
report-automation · deliver on a schedule · 3,135 words
Sets up recurring reports that arrive on time with fresh data, reach the right people, and raise an alert when they fail, instead of silently sending stale numbers.
Data storytelling
data-storytelling · communicate the result · 3,418 words
Turns an analysis into a narrative that drives a decision: one audience, one governing message, an answer-first pyramid structure, the fewest charts that carry the point, and a check that the story does not mislead.
Dashboard filters and interactivity
dashboard-filters-interactivity · design the dashboard · 4,113 words
Designs the filters, controls and linked interactions on a dashboard so a viewer answers their own question fast: the right control per filter, sensible defaults, deliberate cross-filtering, correct filter order of operations, and a performance budget.
No skill matches that search. Clear it or choose All.
What dashboards and reporting skills do for an AI agent
A general model can build a dashboard or write a report on its own, but left to guess it fills the screen with every metric it can find, picks a chart because it looks neat, and buries the one number that matters. These skills replace guesswork with decision rules: which metrics earn a place, where the eye should land first, which chart fits the question, and what the reader should do once they have read it. Each skill is tool-agnostic, so the same reasoning holds whether the output is a spreadsheet, a BI tool or an HTML page.
Where to start
Begin with metric-selection to settle which few numbers are worth tracking at all. Move on to dashboard-design, since the hierarchy and layout decide whether anyone returns to the dashboard a second time, and chart-selection to pick each chart type from the question being asked rather than from habit. Use report-automation when the result should be delivered on a schedule, and the data-storytelling skill under communication and presentations when the output is a written report or a deck that carries a recommendation.
What the agent needs from you
Tell the agent who will read the dashboard or report and the decision it supports, which is the single input that changes every later choice. Give it the metrics and their definitions, the comparison each number needs (a target, the prior period or a benchmark), and how fresh the data is. Confirm whether anything will be sent, scheduled or published on someone’s behalf, because those steps wait for your sign-off.
Frequently asked questions
What counts as a dashboard versus a report?
A dashboard is a standing, at-a-glance view that a person checks to monitor or act on something, and it refreshes on its own. A report is a point-in-time document that explains what happened and recommends a next step. If the metric rarely changes or the insight is one-off, a scheduled report or a short note beats a live dashboard.
How many metrics should a dashboard show?
Keep each view to about five to nine elements and three to five focal metrics, which is roughly what working memory holds at a glance. More than that and nothing stands out. Split the rest into linked views by audience rather than stacking everything on one screen. The dashboard-design skill sets out the full rule.
Do these skills depend on a particular tool?
No. The reasoning holds in a spreadsheet, Power BI, Tableau, Looker or a hand-built page, and each skill keeps any tool-specific notes in a separate appendix. You bring the tool; the skill brings the decisions.
Will an agent publish or email a report by itself?
Not without your say-so. Sending, scheduling and publishing are treated as irreversible, so the skills default to a draft for you to approve. You stay the one who decides when a report goes out.
Sources and more data skills
Each skill lists its own sources with the date it was last checked, drawing on data visualisation research and business reporting practice, including Stephen Few, the Financial Times Visual Vocabulary, the International Business Communication Standards and Nielsen Norman Group. For the analysis that feeds a dashboard, see the data-analysis skills; for the data behind it, see data cleaning and preparation.